We frequently observe that many local websites look great on a desktop monitor but struggle to load quickly on a smartphone. That slight delay is more than a technical glitch. It is the exact reason we created this Core Web Vitals Guide for Southwestern Ontario Businesses.
Our team has observed exactly how strict Google has become with its performance thresholds in 2026. Sites failing these speed tests often lose their competitive edge in local search results.
Let’s examine the specific metrics causing these drop-offs and outline a clear plan to resolve them.
What Are Core Web Vitals?
We evaluate hundreds of sites every year, and Core Web Vitals remain the decisive tiebreaker for search rankings in 2026. These three specific metrics measure loading performance, interactivity, and visual stability. Google introduced them as part of its Page Experience update to quantify the actual, real-world experience a visitor has on your page.
Our analysis aligns with recent industry data showing the direct financial impact of these metrics. A 2026 study by Portent found that an e-commerce site loading in one second has a conversion rate three times higher than a site taking five seconds. This means that a slow website directly costs you sales and valuable leads.
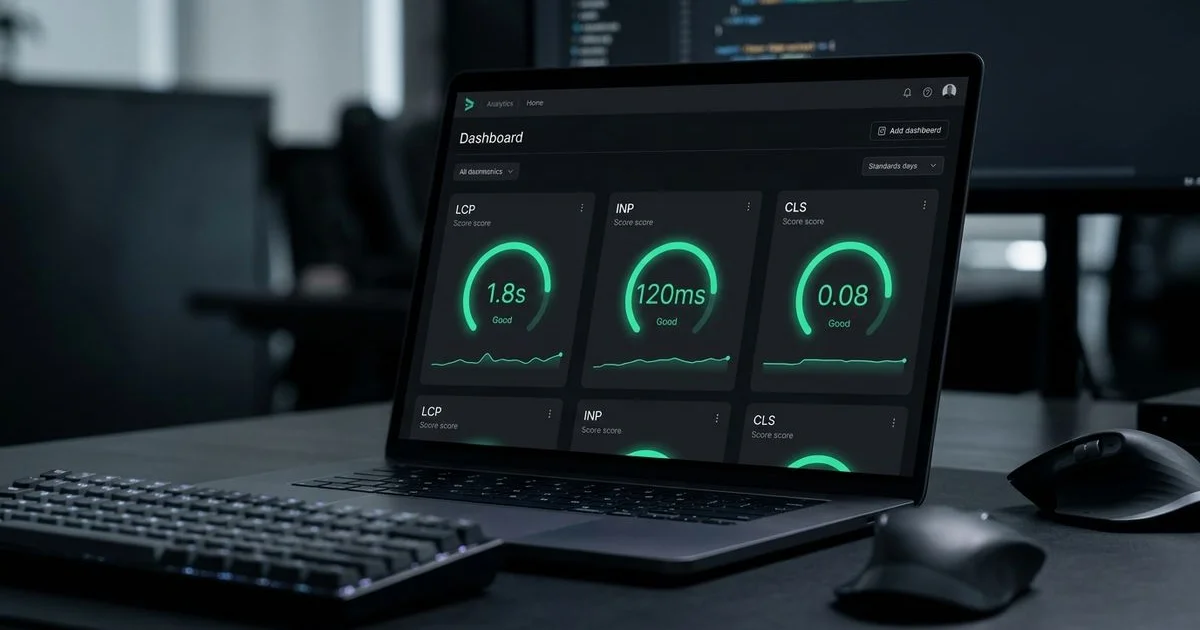
Here are the three essential performance metrics you need to monitor:
- Largest Contentful Paint (LCP): Evaluates raw loading speed.
- Interaction to Next Paint (INP): Measures immediate responsiveness to clicks.
- Cumulative Layout Shift (CLS): Tracks the visual stability of the page layout.
You can verify your current standing using tools like Google PageSpeed Insights or Chrome DevTools.
Largest Contentful Paint (LCP)
We consider Largest Contentful Paint to be the foundational metric for user retention. LCP measures exactly how long it takes for the most massive visible element on your screen to fully render. This element is usually a hero image, a bold headline, or a promotional video thumbnail.
Google classifies an LCP score of 2.5 seconds or faster as a passing grade. Many local sites fail this test because they upload massive, 4MB uncompressed photos directly to their homepage. Heavy files combined with slow server response times will ruin your LCP score immediately.
Actionable Steps to Fix LCP Delays
Our developers rely on a few proven strategies to accelerate visual loading times. Implementing these changes often cuts loading delays in half.
- Adopt next-generation image formats. Convert standard JPEGs to WebP or AVIF formats. A 1200-pixel wide hero image compressed to WebP rarely exceeds 100KB.
- Implement a Content Delivery Network (CDN). A CDN stores copies of your website files on servers closer to the user. If your primary host is in Vancouver but your customer is in London, Ontario, a CDN bridges that geographical gap.
- Upgrade your hosting infrastructure. Cheap shared hosting plans often suffer from terrible Time to First Byte (TTFB) delays. Moving to a premium managed host on a Canadian server location drastically improves response times.
- Eliminate render-blocking code. Defer non-essential JavaScript and CSS files so the browser prioritizes painting the main visual content first.
We regularly help Southwestern Ontario businesses drop their LCP times from over four seconds down to under two seconds. A simple image compression audit and a server upgrade make an enormous difference. If you need an expert to evaluate your current setup, our SEO services include comprehensive technical audits to pinpoint these exact bottlenecks.
Interaction to Next Paint (INP)
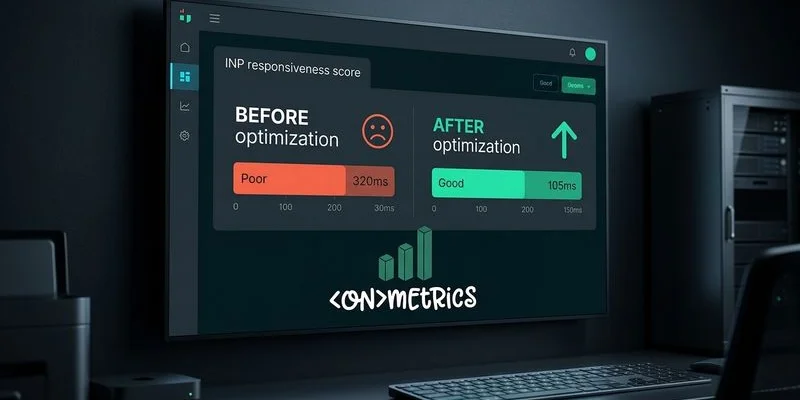
Our team closely monitored the transition when Interaction to Next Paint officially replaced First Input Delay (FID) in March 2024. While FID only tracked the delay of the very first click, INP measures the latency of every single interaction during the entire visit. This includes tapping buttons, opening mobile menus, and typing into contact forms.
Google sets the bar for a good INP score at 200 milliseconds or less. Any delay stretching beyond 500 milliseconds earns a poor rating. According to recent industry data from Webnames Blog, Canadian businesses that successfully optimize their INP often see conversion rate improvements ranging from 10% to 30%.
Common Culprits Behind Poor INP
We frequently discover that sluggish interactivity stems from a few specific technical flaws. Modern websites often carry too much hidden baggage that clogs up the browser.
| Technical Issue | How It Impacts Interactivity |
|---|---|
| Heavy Third-Party Scripts | Analytics tools, chat widgets, and social media embeds fight for processing power. |
| Bloated JavaScript Bundles | Single-page applications force the browser to process massive code blocks before responding. |
| Complex DOM Structures | Pages overloaded with thousands of HTML elements take much longer to update visually. |
How to Accelerate Page Responsiveness
Our standard optimization process focuses on clearing the main thread so the browser can react instantly. You must prioritize the user’s immediate actions over background tracking tasks.
- Audit all external scripts. Remove the marketing tools and chat widgets you no longer actively use.
- Delay non-critical features. Use lazy-loading techniques for interactive elements placed below the fold.
- Break up long JavaScript tasks. Ensure that no single background process locks up the main thread for more than 50 milliseconds.
Cumulative Layout Shift (CLS)
We have all experienced the intense frustration of trying to tap a link, only to have the entire page jump abruptly. You end up clicking the wrong button or accidentally closing a window. This jarring movement is called Cumulative Layout Shift, and it actively destroys user trust.
Google considers a CLS score of 0.1 or less to be a passing grade. This metric calculates how much the visible content shifts unexpectedly while the page is still rendering.
What Causes Frustrating Layout Shifts?
Our developers typically trace layout instability back to unreserved spacing. When the browser does not know how much room an element needs, it pushes the surrounding text out of the way once that element finally loads.
- Images lacking dimension attributes. Failing to specify width and height in the HTML forces the browser to guess the image size.
- Late-loading dynamic content. Banner ads, promotional pop-ups, and embedded Google Maps inject themselves into the layout late in the process.
- Custom web font delays. When a stylized custom font replaces a basic fallback font, the text size changes and pushes nearby elements up or down.
Strategies to Stabilize Your Layout
We eliminate jumping layouts by giving the browser a precise blueprint of the page before any heavy files finish downloading. Predictable spacing is the secret to a stable user experience.
- Declare dimensions for all media. Always include precise width and height attributes for images and videos in your source code.
- Reserve permanent space for ads. Use CSS to define a minimum height for any container that holds dynamic content or third-party embeds.
- Optimize font loading. Implement the
font-display: swapproperty alongside size-adjusted fallback fonts to prevent aggressive text reflow.
Why This Core Web Vitals Guide for Southwestern Ontario Businesses Matters
We know that local service providers face intense competition in a highly concentrated geographic market. When a homeowner searches for an emergency plumber or a nearby coffee shop, Google presents only a few prime local options. If a competitor operates a site that loads in 1.5 seconds and yours drags on for 5 seconds, Google has a concrete, data-backed reason to rank them higher.
The financial penalty for a sluggish website is severe. While older studies suggested a one-second delay caused a 7% drop in conversions, recent 2026 data indicates the damage is much worse.
According to a comprehensive 2026 study by Portent, an e-commerce site loading in one second has a conversion rate three times higher than a site taking five seconds.
Mobile performance is the most critical battleground for local visibility. Over 60% of all local searches happen on smartphones, and mobile internet speeds outside of London’s urban core can be inconsistent. Optimizing your Core Web Vitals guarantees your digital storefront remains accessible, whether a customer is browsing downtown or from a rural county road.
How to Measure Your Core Web Vitals
We always begin our optimization projects by gathering objective baseline data. You cannot improve a metric until you know exactly where you currently stand.
Here are the most reliable, free diagnostic tools available:
- Google PageSpeed Insights: This tool provides a detailed breakdown of both simulated lab data and actual field data from real users.
- Google Search Console: The dedicated Core Web Vitals report highlights exactly which URLs pass or fail across your entire domain.
- Chrome DevTools: The built-in browser Performance panel allows developers to profile a page and isolate the exact scripts causing bottlenecks.
Our strongest advice is to prioritize field data over lab data. Lab data is generated in a controlled environment, which is excellent for initial debugging. Google actually bases its ranking decisions entirely on field data collected from the Chrome User Experience Report (CrUX). This CrUX data represents a 28-day rolling average of how real humans actually experience your website on their own devices.
Next Steps
We view performance optimization as an ongoing commitment rather than a singular checklist. Your scores will naturally fluctuate as you publish new content, update software plugins, and launch new marketing tools.
Start by documenting your current baseline scores using the tools mentioned in this Core Web Vitals Guide for Southwestern Ontario Businesses. Tackle the most severe image size issues first, and schedule regular retests.
Do not let a slow website cost you another customer.
If you are unsure where to begin diagnosing these errors, contact us for a free consultation. At ONmetrics, our developers help Southwestern Ontario businesses engineer high-performing platforms that capture attention and drive revenue. You can also explore our web design services to see how we construct lightning-fast digital experiences entirely from scratch.