Our team is constantly asked how to measure true marketing ROI (not just clicks and impressions). Business owners in London, Ontario, frequently tell us their marketing agency reported 50,000 impressions and a high click-through rate.
The room goes entirely quiet when someone asks what those numbers translated to in actual revenue.
This disconnect is incredibly common today. A January 2026 Best Law Firms survey found that just 41% of Canadian firms actually have the technology in place to measure the return on their marketing investment.
Vanity metrics are just activity indicators. Building your strategy around them is like evaluating a restaurant by foot traffic instead of paying diners.
We are going to break down the main reasons this measurement gap happens. Next, the following sections will walk through the exact frameworks required to track real revenue.
The Problem with Last-Click Attribution
Most businesses that think they are measuring ROI are actually using last-click attribution. This is the default model in most advertising platforms. It gives 100% of the credit for a conversion to the final touchpoint before someone converts.
Our experience as a professional service team shows this creates a deeply misleading picture. Consider a typical customer journey for a homeowner in London or Toronto looking for an HVAC contractor:
- They search “best HVAC companies Ontario” and click on an organic SEO result.
- Two days later, they see a Meta Ads campaign and click through to read a blog post.
- A week later, they search the company name directly and click a Google Ad.
- They call and book a $5,000 service appointment.
Under last-click attribution, the branded Google Ad gets 100% of the credit. The organic SEO and social media channels get zero credit, even though they introduced the customer and built trust. You look at the report and think Google Ads is the only profitable channel.
This specific blind spot causes companies to slash budgets on the exact channels filling their pipeline. A 2025 report by Team Velocity noted that nearly 60% of martech spend is wasted or underutilized, often because companies misunderstand their own attribution data.
What Multi-Touch Attribution Actually Looks Like
Multi-touch attribution distributes credit across every interaction in the customer journey. There are several models to choose from, each offering different strengths for different business setups.
Our analysts frequently compare these standard models to find the right fit:
| Attribution Model | How It Works | Best Use Case |
|---|---|---|
| Linear | Gives equal credit to every touchpoint. | Simple, long-cycle B2B tracking. |
| Time-Decay | Gives more credit to recent interactions. | Short sales cycles with promotional offers. |
| Position-Based | 40% to first, 40% to last, 20% to middle. | Businesses valuing both discovery and closing. |
| Data-Driven | Uses machine learning to assign credit. | High-volume accounts with consistent traffic. |
Google Analytics 4 (GA4) uses Data-Driven Attribution as its default setting. A critical 2026 insider tip from Cometly reveals a major pitfall here. If your GA4 property does not hit 400 conversions and 20,000 total events within the lookback window, the system silently falls back to a last-click model without notifying you.
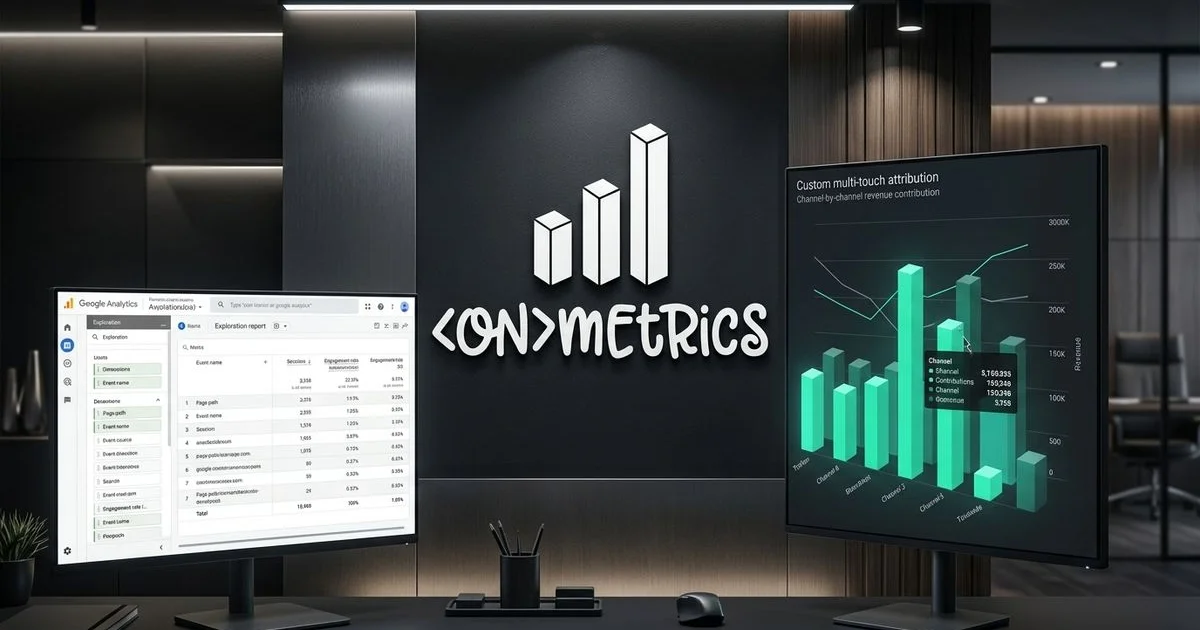
We prevent this blind spot by implementing multi-touch attribution through ONclix, our advanced attribution tracking platform. ONclix captures every touchpoint across a customer’s journey, from the first organic search to the final form submission. The platform then connects those interactions directly to actual revenue in your CRM.
How to Measure True Marketing ROI (Not Just Clicks and Impressions) Using Financial Metrics
Let us be very direct about vanity metrics. Clicks and impressions are inputs, not business outcomes. They tell you that activity is happening on your website, but they completely fail to confirm if that activity is generating money.
Here are the specific financial metrics that actually matter for your bottom line:
- Cost Per Acquisition (CAC): This measures how much you spend to acquire one paying customer. If your Google Ads spend is $2,000 a month and generates 10 customers, your CAC is $200.
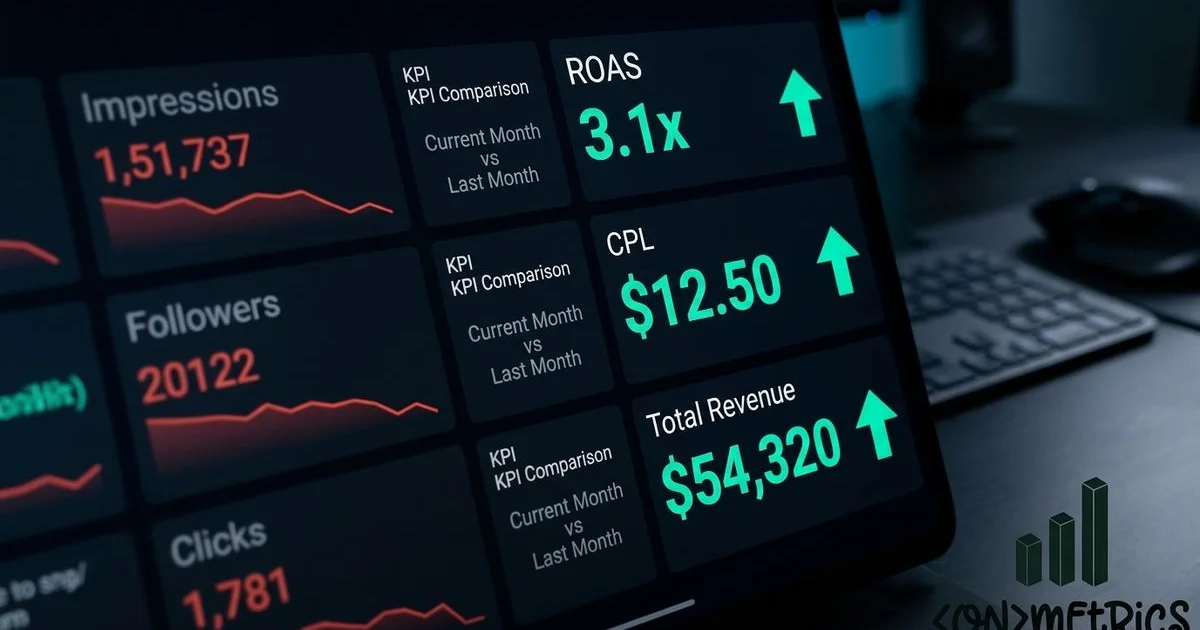
- Return on Ad Spend (ROAS): This measures revenue generated per dollar spent on advertising. A ROAS of 5 to 1 means every dollar in ad spend produces five dollars in revenue.
- Customer Lifetime Value (CLV): This measures the total revenue a customer generates over their entire relationship with your business.
- Pipeline Value: This tracks the total potential revenue of leads generated by marketing, which is crucial for B2B companies with long sales cycles.
Our team relies heavily on the CLV to CAC ratio to determine campaign health. According to 2026 data from Vena Solutions, the average CAC for B2B SaaS companies in Canada is around $239. The gold standard target for a healthy business is a CLV to CAC ratio of 3 to 1.
You might reject a campaign with a $300 CAC as too expensive if you only look at the upfront cost. That same campaign becomes your most valuable asset when you realize those customers spend $5,000 over three years.
Practical Steps to Measure Real ROI
Step 1: Connect Your Marketing Data to Revenue
Your analytics platform, ad accounts, and CRM absolutely must share data. When a lead comes in from a Google Ad, you need to track that lead through your sales process all the way to closed revenue.
Most businesses fall apart at this exact stage because their marketing data and sales data live in isolated silos. For example, Meta Ads Manager shows a lead was captured, but Salesforce or HubSpot cannot see if that lead actually bought anything.
Our custom solution, ONclix, fixes this by creating a unified tracking layer. It follows the customer from first click to closed deal, accurately attributing revenue back to the specific channels that influenced the sale.
Step 2: Implement UTM Parameters Consistently
Every link in every active campaign should include standard UTM parameters:
- Source: The platform sending the traffic (e.g., Google).
- Medium: The type of traffic (e.g., CPC).
- Campaign: The specific promotion name.
- Content: The specific ad variation or image.
Inconsistent UTM tagging remains one of the most common reasons businesses fail to track their marketing performance accurately. You need to create a standardized naming convention and document it for your entire staff. The terms “google”, “Google”, and “google-ads” show up as three completely different sources in your analytics dashboard.
We strongly recommend using a standardized Google Sheet builder or a dedicated tool like UTM.io. This prevents manual entry errors and stops fragmented data from ruining your reporting.
Step 3: Track Offline Conversions
Offline conversion tracking is essential if your business generates leads online but closes deals over the phone, in person, or via email. You must import your closed-deal data back into Google Ads and other platforms.
This step allows the advertising algorithms to optimize for actual revenue instead of just cheap form submissions. Features like Google Ads Enhanced Conversions or the Meta Conversions API help bridge this gap.
Our integration specialists use these APIs to bypass cookie loss and feed real sales data back to the ad networks. This ensures your budget automatically shifts to the audiences most likely to sign a contract.
Step 4: Set Up Proper Conversion Values
Not all website conversions are worth the same amount of money. A request for a $50,000 home renovation quote is significantly more valuable than a simple newsletter signup.
Pro-Tip: You should assign dynamic values to your conversion actions based on historical close rates and average deal sizes. If you know that 10% of consultation requests turn into a $5,000 job, assign a $500 value to that specific goal completion in your analytics platform.
We always set up value-based bidding once these numbers are in place. This allows the machine learning algorithms to optimize for the highest possible return on investment.
Step 5: Review Monthly with a Revenue Lens
It is time to stop reviewing marketing reports that only highlight clicks and impressions. Your monthly marketing review should focus entirely on business outcomes and profitability.
Every executive meeting needs to answer three specific questions:
- How much total money did we spend?
- How much verified revenue did our marketing generate?
- What is our blended ROAS across all active channels?
You have a serious measurement problem if your agency cannot answer these questions. This must be addressed before you increase your spend on any new initiative.
Our most successful partners view marketing as a revenue engine, not an expense category.
Making Better Decisions with Better Data
Learning how to measure true marketing ROI (not just clicks and impressions) gives you the ability to make confident budget allocation decisions. You will know exactly which channels deserve more investment and which campaigns to pause.
Our clients consistently find that tracking their customer acquisition costs leads to much faster, sustainable growth.
For businesses in London, Ontario, and across Canada looking to move beyond vanity metrics, ONmetrics provides the exact data visualization and attribution infrastructure needed to connect marketing spend to real revenue. Reach out to start a conversation about what proper ROI measurement could look like for your specific business.